
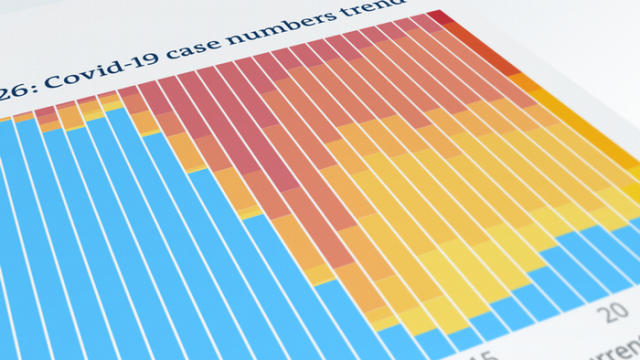
The majority of countries report falling COVID infection numbers. DW sums up the global data on the current pandemic situation in three charts.
By DW
Jun 9, 2022
We started this data analysis in June 2020 at a time when countries reported a record-breaking number of new COVID-19 cases almost every day. We wanted to find a way to contextualize the trends and information so that you could understand whether the situation was getting better or worse in your particular country, week-by-week. We wanted to show where the numbers were rising exponentially and where they were falling.
When we started writing this piece, we assumed that we would eventually come back to a world of zero COVID – and designed the trend accordingly.
But after two years of the pandemic and a lot of scientific research into it, a full return to zero COVID seems unlikely. That is one of the main reasons why we have decided to discontinue regular updates.
The data does, however, show a small but increasing number of countries reporting zero cases. In some cases that data is credible, while in other cases it is harder to verify the credibility of the data.

Several countries have extended their reporting intervals, making case numbers potentially less comparable in the long run. Checking the numbers manually and adjusting the numbers to allow us to compare them fairly would quickly become an overwhelming task.
But with vaccination programs running across the globe, national health services seem increasingly able to contain the virus: newly reported case numbers are comparatively low across the continents or continue to fall.

So, that is why we have decided to discontinue reporting these trends as frequently as we have done in the past two years. If the need arises in the future, we will consider reviving reporting this trend.
At time of writing, the following countries were hit particularly hard by the pandemic (the two-year period of our coverage to June 2022):

More than 50% of population infected as of June 2022:
- Europe: Andorra, Denmark, Iceland, San Marino
Between 40% and 50% of population infected as of June 2022:
- Africa: Seychelles
- Asia: Cyprus, Georgia, Israel
- Europe: Austria, Estonia, France, Latvia, Liechtenstein, Luxembourg, Netherlands, Portugal, Slovakia, Slovenia, Switzerland
Between 20% and 40% of population infected as of June 2022:
- Américas: Argentina, Barbados, Panama, US, Uruguay
- Asia: Bahrain, Brunei, South Korea, Maldives, Mongolia, Singapore
- Europe: Belgium, Croatia, Czech Republic, Finland, Germany, Greece, Ireland, Italy, Lithuania, Monaco, Montenegro, Norway, Serbia, Spain, Sweden, United Kingdom
- Oceania: Australia, New Zealand, Palau
Between 1% and 20% of population infected as of June 2022:
- Africa: Botswana, Cabo Verde, Djibouti, Equatorial Guinea, Eswatini, Gabon, Lesotho, Libya, Mauritania, Mauritius, Morocco, Namibia, Rwanda, Sao Tome and Principe, South África, Tunisia, Zambia, Zimbabwe
- Américas: Antigua and Barbuda, Bahamas, Belize, Bolivia, Brazil, Canada, Chile, Colombia, Costa Rica, Cuba, Dominica, Dominican Republic, Ecuador, El Salvador, Grenada, Guatemala, Guyana, Honduras, Jamaica, México, Paraguay, Perú, Saint Kitts and Nevis, Saint Lucia, Saint Vincent and the Grenadines, Suriname, Trinidad and Tobago, Venezuela
- Asia: Armenia, Azerbaijan, Bangladesh, Bhutan, Burma, India, Indonesia, Iran, Iraq, Japan, Jordan, Kazakhstan, Kuwait, Kyrgyzstan, Laos, Lebanon, Malaysia, Nepal, Oman, Philippines, Qatar, Saudi Arabia, Sri Lanka, Taiwan, Thailand, Timor-Leste, Turkey, United Arab Emirates, Vietnam, West Bank and Gaza
- Europe: Albania, Belarus, Bosnia and Herzegovina, Bulgaria, Hungary, Kosovo, Malta, Moldova, North Macedonia, Poland, Romania, Russia, Ukraine
- Oceania: Fiji, Kiribati, Samoa, Solomon Islands, Tonga, Vanuatu
…
Read More: DW – COVID-19: Pandemic trends in 3 charts
…